news
2010/04/20
-
main functions rewritten: it should be easier to add new markup
-
add dimnames in ascii.table()
-
style, align and valign accept matrix
-
t/b/l/rgroup accept several groups (in a list)
-
header and footer accept an integer (number of lines for the header)
-
t/b/l/rstyle can be "h" (for "header")
-
caption, caption.level, align, valign, style, frame, grid have NULL default value
2010/02/05
-
textile support
-
fix a bug in asciidoc labeled list, when labels begin with a number
-
fix bug with RweaveDrivers when split = TRUE
2009/11/25
-
fix several bugs in ascii.freqtable and ascii.meanscomp
-
fix several bugs in asciidoc table header
2009/11/24
-
version 0.4
-
remove extra \n when there is no R output
-
change the name of Sphinx related functions to ReST
-
add methods for freq(), compmeans() and CrossTable() in package descr
-
remove cgroup and rgroup arguments in ascii() function
-
four new arguments : tgroup (top), bgroup (bottom), lgroup (left) and rgroup (right)
-
new arguments escape and list.escape in print.ascii() function
2009/10/28
-
"results=ascii" for all drivers
-
method for ftable objects
-
method for packageDescription objects
-
method for sessionInfo objects
-
fix warning with asciidoc list output
2009/10/24
-
small bug fix
2009/10/24
-
version 0.3
-
list.type can be "label"
-
ascii.simple.list method
-
rownames and colnames arguments
-
cgroup for txt2tags output
-
improve col alignment in txt2tags output
-
sphinx driver and output
-
org driver and output
-
improve row and col span (cgroup and rgroup)
-
remove SweaveAscii() function
-
Asciidoc(), T2t(), Sphinx() and Org() (wrapper for Sweave("file.Rnw", RweaveXxx))
2009/07/16
-
version 0.2
-
digit and format accept matrix, (each cell can have its own number of digits a nd format)
-
new arguments (cgroup, rgroup, …) to define major column and row heading s like in Hmisc::latex() (only for asciidoc output)
-
column style and alignment use cell specifiers
-
remove SweaveSyntaxAscii (bug when ] is used inside Sexpr:[])
2009/05/11
-
\SweaveOpts{} now works
-
add SweaveSyntaxAscii (SweaveOpts:[], Sexpr:[])
-
add a simple wrapper for Sweave() (SweaveAscii()) that use RweaveAsciidoc and SweaveSyntaxAscii as default
2009/04/27
-
add a caption.level argument
-
improve ascii.describe output (package Hmisc)
2009/04/08
-
update DESCRIPTION (with homepage)
-
support for describe function in package Hmisc
short example
<<>>=
x <- matrix(1:4, 2, 2)
x
@
gives :
> x <- matrix(1:4, 2, 2)
> x
     [,1] [,2]
[1,]    1    3
[2,]    2    4
<<results=ascii,echo=FALSE>>=
ascii(x, caption = "A simple matrix", width = 30)
@
gives :
1.00 |
3.00 |
2.00 |
4.00 |
what ascii provides
ascii provided :
-
a generic method for common R objects: ascii(). Default argument depends of R object,
-
several Sweave drivers: RweaveAsciidoc(), RweaveT2t(), RweaveReST(), RweaveOrg() and RweaveTextile().
-
some simple wrappers for Sweave("yourfile.Rnw", RweaveXxx) named Asciidoc(), T2t(), ReST(), Org() and Textile().
features/options
See ?ascii for a complete description of all arguments.
| asciidoc | txt2tags | rest | org | ||
|---|---|---|---|---|---|
Arguments |
|||||
include.rownames |
yes |
yes |
yes |
yes |
|
include.colnames |
yes |
yes |
yes |
yes |
|
rownames |
yes |
yes |
yes |
yes |
|
colnames |
yes |
yes |
yes |
yes |
|
format |
yes |
yes |
yes |
yes |
|
digits |
yes |
yes |
yes |
yes |
|
decimal.mark |
yes |
yes |
yes |
yes |
|
na.print |
yes |
yes |
yes |
yes |
|
caption |
yes |
yes |
yes |
yes |
|
caption.level |
yes |
yes |
yes |
yes |
|
width |
yes |
no |
no |
no |
|
frame |
yes |
yes (all or none) |
no |
no |
|
grid |
yes |
no |
no |
no |
|
valign |
yes |
no |
no |
no |
|
header |
yes |
yes |
yes |
yes |
|
footer |
yes |
yes |
no |
no |
|
align |
yes |
yes |
no |
no |
|
col.width |
yes |
no |
no |
no |
|
style |
yes |
yes |
yes |
yes |
|
tgroup |
yes |
yes |
yes |
no |
|
n.tgroup |
yes |
yes |
yes |
no |
|
talign |
yes |
yes |
no |
no |
|
tvalign |
yes |
no |
no |
no |
|
tstyle |
yes |
yes |
yes |
no |
|
bgroup |
yes |
no |
yes |
no |
|
n.bgroup |
yes |
no |
yes |
no |
|
balign |
yes |
no |
no |
no |
|
bvalign |
yes |
no |
no |
no |
|
bstyle |
yes |
no |
yes |
no |
|
lgroup |
yes |
no |
yes |
no |
|
n.lgroup |
yes |
no |
yes |
no |
|
lalign |
yes |
no |
no |
no |
|
lvalign |
yes |
no |
no |
no |
|
lstyle |
yes |
no |
yes |
no |
|
rgroup |
yes |
no |
yes |
no |
|
n.rgroup |
yes |
no |
yes |
no |
|
ralign |
yes |
no |
no |
no |
|
rvalign |
yes |
no |
no |
no |
|
rstyle |
yes |
no |
yes |
no |
|
list.type |
yes |
yes |
yes |
yes |
|
condense |
yes |
yes |
yes |
yes |
|
Output |
|||||
html |
yes |
yes |
yes |
yes |
|
docbook |
yes |
yes |
no |
yes |
|
latex |
yes (experimental) |
yes |
yes (col and row spans not implemented yet) |
yes |
|
Feature |
|||||
syntax color |
yes (but not for R…) |
no |
yes |
yes |
ascii examples
ascii provides methods for:
> methods(ascii)
 [1] ascii.anova*              ascii.aov*
 [3] ascii.aovlist*            ascii.cast_df*
 [5] ascii.character*          ascii.coxph*
 [7] ascii.CrossTable*         ascii.data.frame*
 [9] ascii.default*            ascii.density*
[11] ascii.describe*           ascii.describe.single*
[13] ascii.factor*             ascii.freqtable*
[15] ascii.ftable*             ascii.glm*
[17] ascii.htest*              ascii.integer*
[19] ascii.list*               ascii.lm*
[21] ascii.matrix*             ascii.meanscomp*
[23] ascii.numeric*            ascii.packageDescription*
[25] ascii.prcomp*             ascii.sessionInfo*
[27] ascii.simple.list*        ascii.smooth.spline*
[29] ascii.summary.aov*        ascii.summary.aovlist*
[31] ascii.summary.glm*        ascii.summary.lm*
[33] ascii.summary.prcomp*     ascii.summary.survfit*
[35] ascii.summary.table*      ascii.survdiff*
[37] ascii.survfit*            ascii.table*
[39] ascii.ts*                 ascii.zoo*

   Non-visible functions are asterisked
sessionInfo
> ascii(sessionInfo())
R version::
   R version 2.12.0 (2010-10-15), i686-pc-linux-gnu
locale::
   LC_CTYPE=fr_FR.utf8, LC_NUMERIC=C, LC_TIME=fr_FR.utf8, LC_COLLATE=fr_FR.utf8, LC_MONETARY=C, LC_MESSAGES=fr_FR.utf8, LC_PAPER=fr_FR.utf8, LC_NAME=C, LC_ADDRESS=C, LC_TELEPHONE=C, LC_MEASUREMENT=fr_FR.utf8, LC_IDENTIFICATION=C
attached base packages::
   stats, graphics, grDevices, utils, datasets, methods, base
other attached packages::
   ascii_0.7, proto_0.3-8
loaded via a namespace (and not attached)::
  tools_2.12.0
- R version
-
R version 2.12.0 (2010-10-15), i686-pc-linux-gnu
- locale
-
LC_CTYPE=fr_FR.utf8, LC_NUMERIC=C, LC_TIME=fr_FR.utf8, LC_COLLATE=fr_FR.utf8, LC_MONETARY=C, LC_MESSAGES=fr_FR.utf8, LC_PAPER=fr_FR.utf8, LC_NAME=C, LC_ADDRESS=C, LC_TELEPHONE=C, LC_MEASUREMENT=fr_FR.utf8, LC_IDENTIFICATION=C
- attached base packages
-
stats, graphics, grDevices, utils, datasets, methods, base
- other attached packages
-
ascii_0.7, proto_0.3-8
- loaded via a namespace (and not attached)
-
tools_2.12.0
vector
> ascii(1:4)
|============================
| 1.00 | 2.00 | 3.00 | 4.00
|============================
1.00 |
2.00 |
3.00 |
4.00 |
matrix
> ascii(VADeaths, include.rownames = T, include.colnames = T, caption = "VADeaths",
+     header = T, col.width = c(1, 2, 2, 2, 2, 2), valign = "middle",
+     align = c("l", "r", "r", "r", "r"), frame = "topbot")
.VADeaths
[frame="topbot",cols="1,2,2,2,2"]
|===================================================================================
1.1+| >.^h| Rural Male >.^h| Rural Female >.^h| Urban Male >.^h| Urban Female
<.^| 50-54  >.^| 11.70       >.^| 8.70          >.^| 15.40       >.^| 8.40
<.^| 55-59  >.^| 18.10       >.^| 11.70         >.^| 24.30       >.^| 13.60
<.^| 60-64  >.^| 26.90       >.^| 20.30         >.^| 37.00       >.^| 19.30
<.^| 65-69  >.^| 41.00       >.^| 30.90         >.^| 54.60       >.^| 35.10
<.^| 70-74  >.^| 66.00       >.^| 54.30         >.^| 71.10       >.^| 50.00
|===================================================================================
Rural Male |
Rural Female |
Urban Male |
Urban Female |
|
50-54 |
11.70 |
8.70 |
15.40 |
8.40 |
55-59 |
18.10 |
11.70 |
24.30 |
13.60 |
60-64 |
26.90 |
20.30 |
37.00 |
19.30 |
65-69 |
41.00 |
30.90 |
54.60 |
35.10 |
70-74 |
66.00 |
54.30 |
71.10 |
50.00 |
data.frame
> ascii(iris[1:10, ], include.rownames = F, caption = "iris", width = 75,
+     align = "c", valign = "bottom", frame = "topbot", grid = "none")
.iris
[frame="topbot",grid="none",width="75%"]
|========================================================================================
^.>h| Sepal.Length ^.>h| Sepal.Width ^.>h| Petal.Length ^.>h| Petal.Width ^.>h| Species
^.>| 5.10          ^.>| 3.50         ^.>| 1.40          ^.>| 0.20         ^.>| setosa
^.>| 4.90          ^.>| 3.00         ^.>| 1.40          ^.>| 0.20         ^.>| setosa
^.>| 4.70          ^.>| 3.20         ^.>| 1.30          ^.>| 0.20         ^.>| setosa
^.>| 4.60          ^.>| 3.10         ^.>| 1.50          ^.>| 0.20         ^.>| setosa
^.>| 5.00          ^.>| 3.60         ^.>| 1.40          ^.>| 0.20         ^.>| setosa
^.>| 5.40          ^.>| 3.90         ^.>| 1.70          ^.>| 0.40         ^.>| setosa
^.>| 4.60          ^.>| 3.40         ^.>| 1.40          ^.>| 0.30         ^.>| setosa
^.>| 5.00          ^.>| 3.40         ^.>| 1.50          ^.>| 0.20         ^.>| setosa
^.>| 4.40          ^.>| 2.90         ^.>| 1.40          ^.>| 0.20         ^.>| setosa
^.>| 4.90          ^.>| 3.10         ^.>| 1.50          ^.>| 0.10         ^.>| setosa
|========================================================================================
Sepal.Length |
Sepal.Width |
Petal.Length |
Petal.Width |
Species |
5.10 |
3.50 |
1.40 |
0.20 |
setosa |
4.90 |
3.00 |
1.40 |
0.20 |
setosa |
4.70 |
3.20 |
1.30 |
0.20 |
setosa |
4.60 |
3.10 |
1.50 |
0.20 |
setosa |
5.00 |
3.60 |
1.40 |
0.20 |
setosa |
5.40 |
3.90 |
1.70 |
0.40 |
setosa |
4.60 |
3.40 |
1.40 |
0.30 |
setosa |
5.00 |
3.40 |
1.50 |
0.20 |
setosa |
4.40 |
2.90 |
1.40 |
0.20 |
setosa |
4.90 |
3.10 |
1.50 |
0.10 |
setosa |
row (and col) headings
> library(reshape)
> ff_d <- melt(french_fries, id = 1:4, na.rm = TRUE)
> toto <- cast(ff_d, treatment + subject ~ variable, mean, margins = "treatment")
> ascii(toto[, -1], lgroup = paste("Treatment:", as.character(unique(toto[,
+     1]))), n.lgroup = c(table(toto[, 1])), rstyle = "s", lvalign = "middle",
+     include.rownames = F)
|====================================================================================
1.1+| h| subject h| potato h| buttery h| grassy h| rancid h| painty
.13+^.^h| Treatment: 1 | 3        | 6.22    | 0.37     | 0.19    | 2.11    | 3.11
| 10       | 9.96    | 6.75     | 0.58    | 4.02    | 1.38
| 15       | 3.36    | 0.72     | 0.42    | 3.96    | 3.26
| 16       | 6.50    | 3.26     | 0.76    | 4.12    | 1.23
| 19       | 9.38    | 3.06     | 2.02    | 5.36    | 2.77
| 31       | 8.84    | 0.44     | 0.09    | 5.94    | 3.21
| 51       | 10.68   | 2.64     | 1.05    | 5.15    | 1.96
| 52       | 5.06    | 0.81     | 0.88    | 4.29    | 2.65
| 63       | 6.78    | 0.03     | 0.00    | 6.05    | 3.85
| 78       | 3.62    | 0.73     | 0.54    | 1.50    | 3.49
| 79       | 8.06    | 0.28     | 0.34    | 0.57    | 0.00
| 86       | 4.18    | 1.77     | 0.81    | 5.49    | 4.11
| (all)    | 6.89    | 1.78     | 0.65    | 4.07    | 2.58
.13+^.^h| Treatment: 2 | 3        | 6.74    | 0.59     | 0.11    | 3.14    | 2.48
| 10       | 9.99    | 6.98     | 0.47    | 2.15    | 0.82
| 15       | 4.41    | 1.31     | 0.34    | 2.29    | 2.06
| 16       | 6.45    | 3.37     | 1.05    | 3.40    | 0.46
| 19       | 8.64    | 2.45     | 1.14    | 5.41    | 4.16
| 31       | 8.03    | 0.62     | 0.16    | 6.05    | 5.06
| 51       | 9.98    | 3.79     | 1.57    | 4.67    | 2.25
| 52       | 5.51    | 1.02     | 1.18    | 4.22    | 2.19
| 63       | 8.41    | 0.10     | 0.01    | 5.09    | 4.36
| 78       | 3.78    | 0.29     | 0.76    | 1.55    | 2.73
| 79       | 7.94    | 0.69     | 0.26    | 1.03    | 0.00
| 86       | 3.99    | 2.06     | 0.78    | 4.52    | 2.84
| (all)    | 7.00    | 1.97     | 0.66    | 3.62    | 2.46
.13+^.^h| Treatment: 3 | 3        | 5.29    | 0.77     | 0.09    | 2.86    | 2.87
| 10       | 10.03   | 6.45     | 0.14    | 3.11    | 0.69
| 15       | 3.96    | 0.99     | 0.44    | 2.55    | 2.37
| 16       | 6.86    | 2.70     | 1.12    | 3.20    | 0.56
| 19       | 8.74    | 1.73     | 2.07    | 7.24    | 3.90
| 31       | 9.03    | 0.65     | 0.17    | 6.58    | 5.13
| 51       | 10.22   | 3.13     | 1.35    | 4.92    | 2.54
| 52       | 5.47    | 0.86     | 0.77    | 3.16    | 2.66
| 63       | 8.06    | 0.07     | 0.12    | 6.18    | 3.10
| 78       | 4.00    | 0.70     | 0.67    | 1.19    | 3.52
| 79       | 7.73    | 0.57     | 0.12    | 1.18    | 0.03
| 86       | 3.87    | 1.63     | 0.94    | 4.11    | 3.03
| (all)    | 6.97    | 1.72     | 0.68    | 3.87    | 2.53
|====================================================================================
subject |
potato |
buttery |
grassy |
rancid |
painty |
|
Treatment: 1 |
3 |
6.22 |
0.37 |
0.19 |
2.11 |
3.11 |
10 |
9.96 |
6.75 |
0.58 |
4.02 |
1.38 |
|
15 |
3.36 |
0.72 |
0.42 |
3.96 |
3.26 |
|
16 |
6.50 |
3.26 |
0.76 |
4.12 |
1.23 |
|
19 |
9.38 |
3.06 |
2.02 |
5.36 |
2.77 |
|
31 |
8.84 |
0.44 |
0.09 |
5.94 |
3.21 |
|
51 |
10.68 |
2.64 |
1.05 |
5.15 |
1.96 |
|
52 |
5.06 |
0.81 |
0.88 |
4.29 |
2.65 |
|
63 |
6.78 |
0.03 |
0.00 |
6.05 |
3.85 |
|
78 |
3.62 |
0.73 |
0.54 |
1.50 |
3.49 |
|
79 |
8.06 |
0.28 |
0.34 |
0.57 |
0.00 |
|
86 |
4.18 |
1.77 |
0.81 |
5.49 |
4.11 |
|
(all) |
6.89 |
1.78 |
0.65 |
4.07 |
2.58 |
|
Treatment: 2 |
3 |
6.74 |
0.59 |
0.11 |
3.14 |
2.48 |
10 |
9.99 |
6.98 |
0.47 |
2.15 |
0.82 |
|
15 |
4.41 |
1.31 |
0.34 |
2.29 |
2.06 |
|
16 |
6.45 |
3.37 |
1.05 |
3.40 |
0.46 |
|
19 |
8.64 |
2.45 |
1.14 |
5.41 |
4.16 |
|
31 |
8.03 |
0.62 |
0.16 |
6.05 |
5.06 |
|
51 |
9.98 |
3.79 |
1.57 |
4.67 |
2.25 |
|
52 |
5.51 |
1.02 |
1.18 |
4.22 |
2.19 |
|
63 |
8.41 |
0.10 |
0.01 |
5.09 |
4.36 |
|
78 |
3.78 |
0.29 |
0.76 |
1.55 |
2.73 |
|
79 |
7.94 |
0.69 |
0.26 |
1.03 |
0.00 |
|
86 |
3.99 |
2.06 |
0.78 |
4.52 |
2.84 |
|
(all) |
7.00 |
1.97 |
0.66 |
3.62 |
2.46 |
|
Treatment: 3 |
3 |
5.29 |
0.77 |
0.09 |
2.86 |
2.87 |
10 |
10.03 |
6.45 |
0.14 |
3.11 |
0.69 |
|
15 |
3.96 |
0.99 |
0.44 |
2.55 |
2.37 |
|
16 |
6.86 |
2.70 |
1.12 |
3.20 |
0.56 |
|
19 |
8.74 |
1.73 |
2.07 |
7.24 |
3.90 |
|
31 |
9.03 |
0.65 |
0.17 |
6.58 |
5.13 |
|
51 |
10.22 |
3.13 |
1.35 |
4.92 |
2.54 |
|
52 |
5.47 |
0.86 |
0.77 |
3.16 |
2.66 |
|
63 |
8.06 |
0.07 |
0.12 |
6.18 |
3.10 |
|
78 |
4.00 |
0.70 |
0.67 |
1.19 |
3.52 |
|
79 |
7.73 |
0.57 |
0.12 |
1.18 |
0.03 |
|
86 |
3.87 |
1.63 |
0.94 |
4.11 |
3.03 |
|
(all) |
6.97 |
1.72 |
0.68 |
3.87 |
2.53 |
summary.table
> ascii(summary(table(1:4, 1:4)))
* Number of cases in table: 4
* Number of factors: 2
* Test for independence of all factors:
** Chisq = 12, df = 9, p-value = 0.2133
** Chi-squared approximation may be incorrect
-
Number of cases in table: 4
-
Number of factors: 2
-
Test for independence of all factors:
-
Chisq = 12, df = 9, p-value = 0.2133
-
Chi-squared approximation may be incorrect
-
labeled list
> ascii(version)
platform::
   i686-pc-linux-gnu
arch::
   i686
os::
   linux-gnu
system::
   i686, linux-gnu
status::

major::
   2
minor::
   12.0
year::
   2010
month::
   10
day::
   15
svn rev::
   53317
language::
   R
version.string::
   R version 2.12.0 (2010-10-15)
- platform
-
i686-pc-linux-gnu
- arch
-
i686
- os
-
linux-gnu
- system
-
i686, linux-gnu
- status
- major
-
2
- minor
-
12.0
- year
-
2010
- month
-
10
- day
-
15
- svn rev
-
53317
- language
-
R
- version.string
-
R version 2.12.0 (2010-10-15)
glm
> counts <- c(18, 17, 15, 20, 10, 20, 25, 13, 12)
> outcome <- gl(3, 1, 9)
> treatment <- gl(3, 3)
> d.AD <- data.frame(treatment, outcome, counts)
> glm.D93 <- glm(counts ~ outcome + treatment, family = poisson())
> glm.D93
Call:  glm(formula = counts ~ outcome + treatment, family = poisson())

Coefficients:
(Intercept)     outcome2     outcome3   treatment2   treatment3
  3.045e+00   -4.543e-01   -2.930e-01    8.717e-16    4.557e-16

Degrees of Freedom: 8 Total (i.e. Null);  4 Residual
Null Deviance:      10.58
Residual Deviance: 5.129        AIC: 56.76
> ascii(glm.D93, caption = "glm.D93")
.glm.D93
|===================================================================
1.1+| h| Estimate h| Std. Error h| z value h| Pr(>\|z\|)
| (Intercept)  | 3.04      | 0.17        | 17.81    | 0.00
| outcome2     | -0.45     | 0.20        | -2.25    | 0.02
| outcome3     | -0.29     | 0.19        | -1.52    | 0.13
| treatment2   | 0.00      | 0.20        | 0.00     | 1.00
| treatment3   | 0.00      | 0.20        | 0.00     | 1.00
|===================================================================
> ascii(anova(glm.D93), caption = "anova glm.D93", include.rownames = T)
.anova glm.D93
|===========================================================
1.1+| h| Df   h| Deviance h| Resid. Df h| Resid. Dev
| NULL       |       |           | 8.00       | 10.58
| outcome    | 2.00  | 5.45      | 6.00       | 5.13
| treatment  | 2.00  | 0.00      | 4.00       | 5.13
|===========================================================
Estimate |
Std. Error |
z value |
Pr(>|z|) |
|
(Intercept) |
3.04 |
0.17 |
17.81 |
0.00 |
outcome2 |
-0.45 |
0.20 |
-2.25 |
0.02 |
outcome3 |
-0.29 |
0.19 |
-1.52 |
0.13 |
treatment2 |
0.00 |
0.20 |
0.00 |
1.00 |
treatment3 |
0.00 |
0.20 |
0.00 |
1.00 |
Df |
Deviance |
Resid. Df |
Resid. Dev |
|
NULL |
8.00 |
10.58 |
||
outcome |
2.00 |
5.45 |
6.00 |
5.13 |
treatment |
2.00 |
0.00 |
4.00 |
5.13 |
describe
> library(Hmisc)
> label(esoph$agegp) <- "Age group"
> label(esoph$alcgp) <- "Alcohol group"
> label(esoph$tobgp) <- "Tobacco group"
> label(esoph$ncontrols) <- "Number of control"
> label(esoph$age) <- "Age"
> units(esoph$age) <- "Years"
> ascii(describe(esoph))
.esoph
* 6 Variable
* 88 Observations

*agegp : Age group*

|========================
| n  | missing | unique
| 88 | 0       | 6
|========================

|==========================================================
1.1+| | 25-34 | 35-44 | 45-54 | 55-64 | 65-74 | 75+
| Frequency | 15    | 15    | 16    | 16    | 15    | 11
| %         | 17    | 17    | 18    | 18    | 17    | 12
|==========================================================

*alcgp : Alcohol group*

|========================
| n  | missing | unique
| 88 | 0       | 4
|========================

0-39g/day (23, 26%), 40-79 (23, 26%), 80-119 (21, 24%), 120+ (21, 24%)

*tobgp : Tobacco group*

|========================
| n  | missing | unique
| 88 | 0       | 4
|========================

0-9g/day (24, 27%), 10-19 (24, 27%), 20-29 (20, 23%), 30+ (20, 23%)

*ncases*

|==========================================================================
| n  | missing | unique | Mean  | .05 | .10 | .25 | .50 | .75 | .90 | .95
| 88 | 0       | 10     | 2.273 | 0.0 | 0.0 | 0.0 | 1.0 | 4.0 | 5.3 | 6.0
|==========================================================================

|=========================================================
1.1+| | 0  | 1  | 2  | 3  | 4 | 5 | 6 | 8 | 9 | 17
| Frequency | 29 | 16 | 11 | 9  | 8 | 6 | 5 | 1 | 2 | 1
| %         | 33 | 18 | 12 | 10 | 9 | 7 | 6 | 1 | 2 | 1
|=========================================================

*ncontrols : Number of control*

|=============================================================================
| n  | missing | unique | Mean  | .05 | .10 | .25 | .50 | .75  | .90  | .95
| 88 | 0       | 30     | 11.08 | 1.0 | 1.0 | 3.0 | 6.0 | 14.0 | 29.1 | 40.0
|=============================================================================

lowest:  1  2  3  4  5, highest: 40 46 48 49 60

*age : Age [Years]*

|========================
| n  | missing | unique
| 88 | 0       | 6
|========================

|==========================================================
1.1+| | 25-34 | 35-44 | 45-54 | 55-64 | 65-74 | 75+
| Frequency | 15    | 15    | 16    | 16    | 15    | 11
| %         | 17    | 17    | 18    | 18    | 17    | 12
|==========================================================
-
6 Variable
-
88 Observations
agegp : Age group
n |
missing |
unique |
88 |
0 |
6 |
25-34 |
35-44 |
45-54 |
55-64 |
65-74 |
75+ |
|
Frequency |
15 |
15 |
16 |
16 |
15 |
11 |
% |
17 |
17 |
18 |
18 |
17 |
12 |
alcgp : Alcohol group
n |
missing |
unique |
88 |
0 |
4 |
0-39g/day (23, 26%), 40-79 (23, 26%), 80-119 (21, 24%), 120+ (21, 24%)
tobgp : Tobacco group
n |
missing |
unique |
88 |
0 |
4 |
0-9g/day (24, 27%), 10-19 (24, 27%), 20-29 (20, 23%), 30+ (20, 23%)
ncases
n |
missing |
unique |
Mean |
.05 |
.10 |
.25 |
.50 |
.75 |
.90 |
.95 |
88 |
0 |
10 |
2.273 |
0.0 |
0.0 |
0.0 |
1.0 |
4.0 |
5.3 |
6.0 |
0 |
1 |
2 |
3 |
4 |
5 |
6 |
8 |
9 |
17 |
|
Frequency |
29 |
16 |
11 |
9 |
8 |
6 |
5 |
1 |
2 |
1 |
% |
33 |
18 |
12 |
10 |
9 |
7 |
6 |
1 |
2 |
1 |
ncontrols : Number of control
n |
missing |
unique |
Mean |
.05 |
.10 |
.25 |
.50 |
.75 |
.90 |
.95 |
88 |
0 |
30 |
11.08 |
1.0 |
1.0 |
3.0 |
6.0 |
14.0 |
29.1 |
40.0 |
lowest: 1 2 3 4 5, highest: 40 46 48 49 60
age : Age [Years]
n |
missing |
unique |
88 |
0 |
6 |
25-34 |
35-44 |
45-54 |
55-64 |
65-74 |
75+ |
|
Frequency |
15 |
15 |
16 |
16 |
15 |
11 |
% |
17 |
17 |
18 |
18 |
17 |
12 |
CrossTable
> library(descr)
> ascii(CrossTable(warpbreaks$wool, warpbreaks$tension, dnn = c("Wool",
+     "Tension")))
*Cell Contents*

* N
* Expected N
* Chi-square contribution
* N / Row Total
* N / Col Total
* N / Table Total

|==================================================
1.1+| h| L     h| M     h| H     h| Total
.6+^.^s| A | 9      | 9      | 9      | 27
| 9.0    | 9.0    | 9.0    |
| 0.000  | 0.000  | 0.000  |
| 0.333  | 0.333  | 0.333  | 0.500
| 0.500  | 0.500  | 0.500  |
| 0.167  | 0.167  | 0.167  |
.6+^.^s| B | 9      | 9      | 9      | 27
| 9.0    | 9.0    | 9.0    |
| 0.000  | 0.000  | 0.000  |
| 0.333  | 0.333  | 0.333  | 0.500
| 0.500  | 0.500  | 0.500  |
| 0.167  | 0.167  | 0.167  |
.2+^.^s| Total | 18     | 18     | 18     | 54
| 0.333  | 0.333  | 0.333  |
|==================================================

*Statistics for All Table Factors*

Pearson's Chi-squared test::
   Chi^2 = 0, d.f. = 2, p = 1
Cell Contents
-
N
-
Expected N
-
Chi-square contribution
-
N / Row Total
-
N / Col Total
-
N / Table Total
L |
M |
H |
Total |
|
A |
9 |
9 |
9 |
27 |
9.0 |
9.0 |
9.0 |
||
0.000 |
0.000 |
0.000 |
||
0.333 |
0.333 |
0.333 |
0.500 |
|
0.500 |
0.500 |
0.500 |
||
0.167 |
0.167 |
0.167 |
||
B |
9 |
9 |
9 |
27 |
9.0 |
9.0 |
9.0 |
||
0.000 |
0.000 |
0.000 |
||
0.333 |
0.333 |
0.333 |
0.500 |
|
0.500 |
0.500 |
0.500 |
||
0.167 |
0.167 |
0.167 |
||
Total |
18 |
18 |
18 |
54 |
0.333 |
0.333 |
0.333 |
Statistics for All Table Factors
- Pearson’s Chi-squared test
-
Chi^2 = 0, d.f. = 2, p = 1
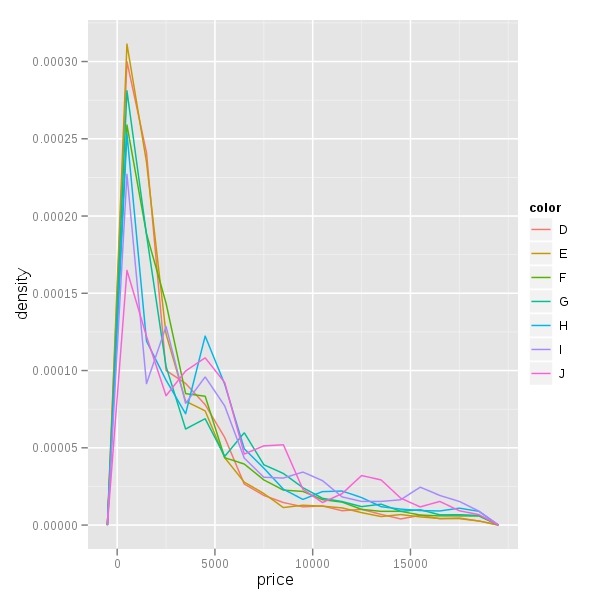
plot
> library(ggplot2)
> p <- qplot(price, ..density.., data = diamonds, geom = "freqpoly",
+     binwidth = 1000, colour = color)
> print(p)
other outputs
> library(reshape)
> names(airquality) <- tolower(names(airquality))
> aqm <- melt(airquality, id = c("month", "day"), na.rm = TRUE)
> res <- cast(aqm, month ~ variable, mean, margins = "grand_row")
> res
  month    ozone  solar.r      wind     temp
1     5 23.61538 181.2963 11.622581 65.54839
2     6 29.44444 190.1667 10.266667 79.10000
3     7 59.11538 216.4839  8.941935 83.90323
4     8 59.96154 171.8571  8.793548 83.96774
5     9 31.44828 167.4333 10.180000 76.90000
6 (all) 42.12931 185.9315  9.957516 77.88235
> print(ascii(res), "t2t")
||  | month | ozone | solar.r | wind  | temp
| 1 | 5     | 23.62 | 181.30  | 11.62 | 65.55
| 2 | 6     | 29.44 | 190.17  | 10.27 | 79.10
| 3 | 7     | 59.12 | 216.48  | 8.94  | 83.90
| 4 | 8     | 59.96 | 171.86  | 8.79  | 83.97
| 5 | 9     | 31.45 | 167.43  | 10.18 | 76.90
| 6 | (all) | 42.13 | 185.93  | 9.96  | 77.88
> print(ascii(res), "rest")
+---+-------+-------+---------+-------+-------+
|   | month | ozone | solar.r | wind  | temp  |
+===+=======+=======+=========+=======+=======+
| 1 | 5     | 23.62 | 181.30  | 11.62 | 65.55 |
+---+-------+-------+---------+-------+-------+
| 2 | 6     | 29.44 | 190.17  | 10.27 | 79.10 |
+---+-------+-------+---------+-------+-------+
| 3 | 7     | 59.12 | 216.48  | 8.94  | 83.90 |
+---+-------+-------+---------+-------+-------+
| 4 | 8     | 59.96 | 171.86  | 8.79  | 83.97 |
+---+-------+-------+---------+-------+-------+
| 5 | 9     | 31.45 | 167.43  | 10.18 | 76.90 |
+---+-------+-------+---------+-------+-------+
| 6 | (all) | 42.13 | 185.93  | 9.96  | 77.88 |
+---+-------+-------+---------+-------+-------+
> print(ascii(res), "org")
|   | month | ozone | solar.r | wind  | temp  |
|---+-------+-------+---------+-------+-------|
| 1 | 5     | 23.62 | 181.30  | 11.62 | 65.55 |
| 2 | 6     | 29.44 | 190.17  | 10.27 | 79.10 |
| 3 | 7     | 59.12 | 216.48  | 8.94  | 83.90 |
| 4 | 8     | 59.96 | 171.86  | 8.79  | 83.97 |
| 5 | 9     | 31.45 | 167.43  | 10.18 | 76.90 |
| 6 | (all) | 42.13 | 185.93  | 9.96  | 77.88 |
Follow those links to see real examples:
convert
Sweave process creates a yourdocument.xxx file from yourdocument.Rnw.
Sweave("youdocument.Rnw", RweaveXxx)
You can convert it to html format with the following command:
asciidoc yourdocument.txt
or
txt2tags -t html yourdocument.t2t
or
rst2html-highlight --stylesheet-path=pygments-default.css -s rest.rst rest.html
or
Alt-X org-export-as-html
or to other formats…
For example, you can see the source of this documentation, the file generated by Sweave, the same file in docbook format, and the same file converted to pdf with dblatex.
more informations
- asciidoc
- txt2tags
- docutils and reStructuredText
- org-mode
- textile
There is another way to create org documents with embedded R code : org-babel. Thanks to Erik Iverson for informing me about org-mode and org-babel.
ascii for real
-
Derek H. Ogle has written some vignettes for the book ‘Analysis and Interpretation of Freshwater Fisheries Data’ using ascii.
-
This blog uses ascii and blogpost to generate and publish post.
-
This blog too but with another method.